The Physical Internet®

Give the street back to people.

Heavy loads ride the rails. Fast trips take the air. Everything in between rides overhead, in solar-powered JPods. The street goes back to walking and biking.

The three layers of the Physical Internet An airplane crosses the sky and a heavy-lift freight train crosses the horizon: the high-speed layer. Solar-powered JPods pods hang from a slim elevated guideway: the middle mile. Below, people walk and bike on a street lined with trees and shops, close to where they live: the last mile. HIGH SPEED · AIR & HEAVY LIFT FREIGHT RAIL — similar to fiber optics MIDDLE MILE · JPODS — similar to WiFi LAST MILE · WALK, BIKE & PROXIMITY — similar to Bluetooth

Three Layers, each doing what it does best

The internet has three layers: fiber for the backbone, WiFi for the neighborhood, Bluetooth for the last few feet. The Physical Internet® has the same three, moving mass instead of data. The trouble today is that one layer, 2-ton cars and trucks on the street, is forced to do all three jobs badly.

High Speed

Freight rail and airplanes

Internet: fiber & satellite backbone

Freight railroads are the heavy lift: 476 ton-miles per gallon, 188 times more efficient than cars. Airplanes are the high speed: people and urgent cargo between cities. Beyond a few hundred miles, freight is already shifting to rail. The backbone exists; it just needs the right connections at each end.
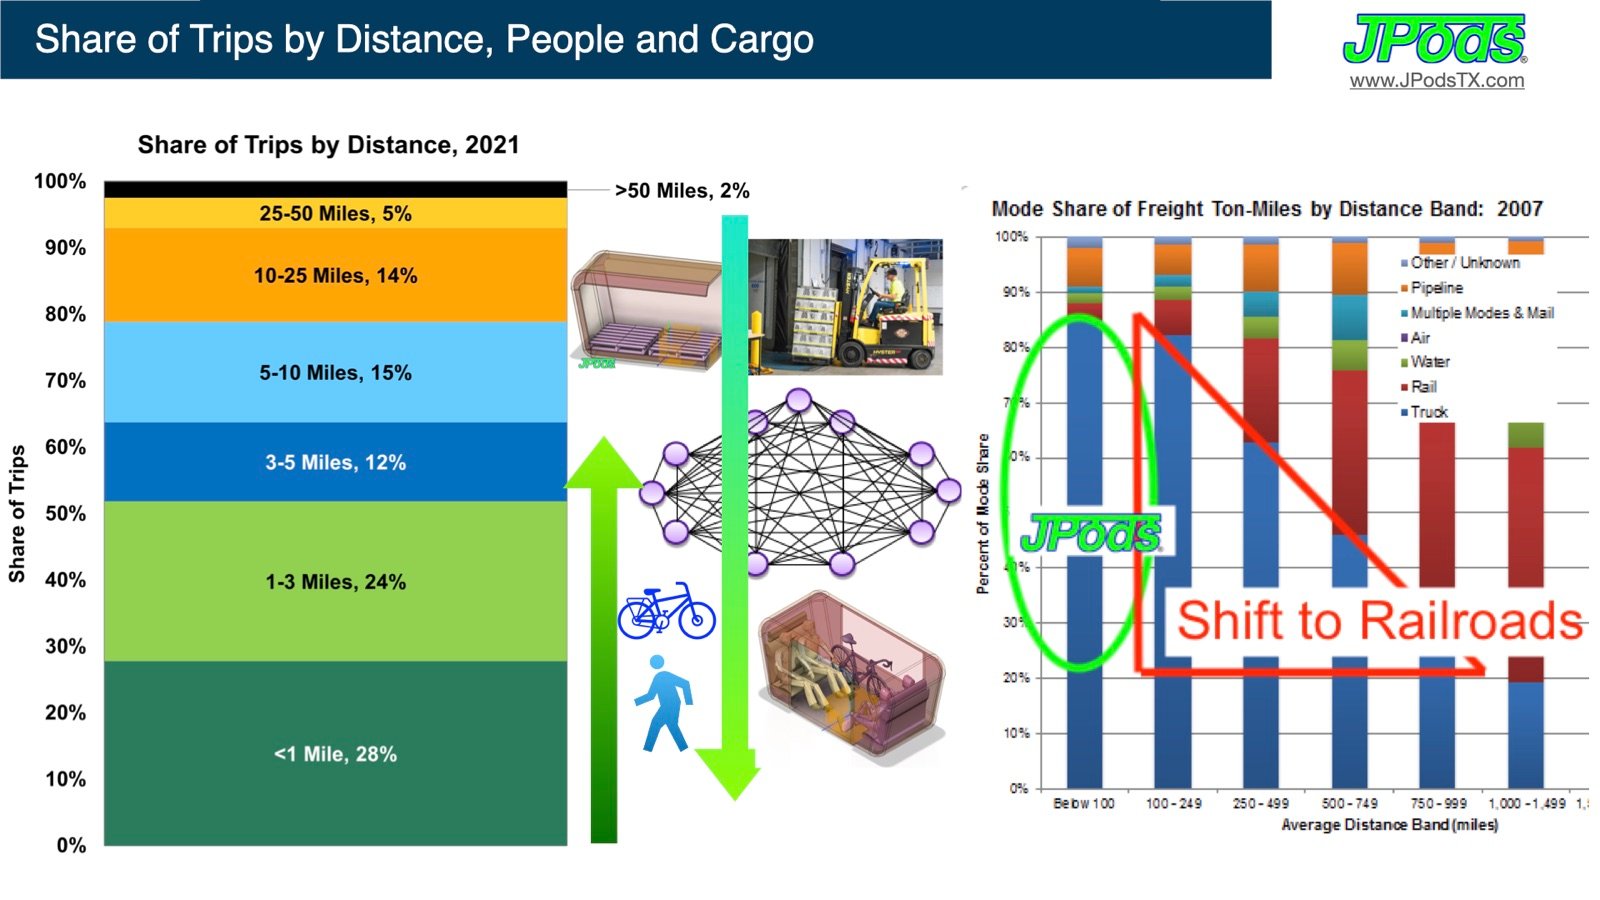
Share of trips by distance for people and cargo; freight ton-miles shift from truck to railroads as distance increases
Middle Mile

JPods

Internet: WiFi

Solar-powered podcars on a mesh of slim guideways above the street. Station to station, neighborhood to neighborhood. People and cargo up to 500 kg, on demand, 24×7, whatever your age, ability, or wealth. Piers about 1 m² every 30 m: it crosses the city without dividing it. This is where the Physical Internet® is built.
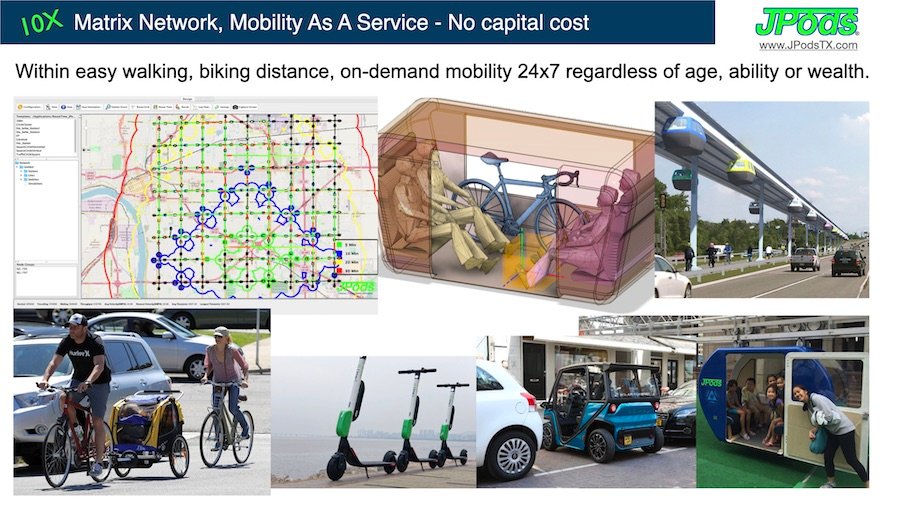
Matrix network map, podcar carrying people and a bike, elevated JPods guideway, and last-mile modes: bikes, scooters, local use vehicles
Last Mile

Safe to walk and bike with increased proximity to retail

Internet: Bluetooth

Walking, bikes, cargo bikes, scooters, local use vehicles. When stations are a 7-minute bike ride or a 15-minute walk away, and 2-ton vehicles are no longer on the street, the last mile is safe again. Parcels arrive at a neighborhood station and go the last few blocks by cargo bike.

Safe streets bring shops back within walking distance: the corner store, the café, the neighborhood retailer. Commerce returns to the pace of people on foot.
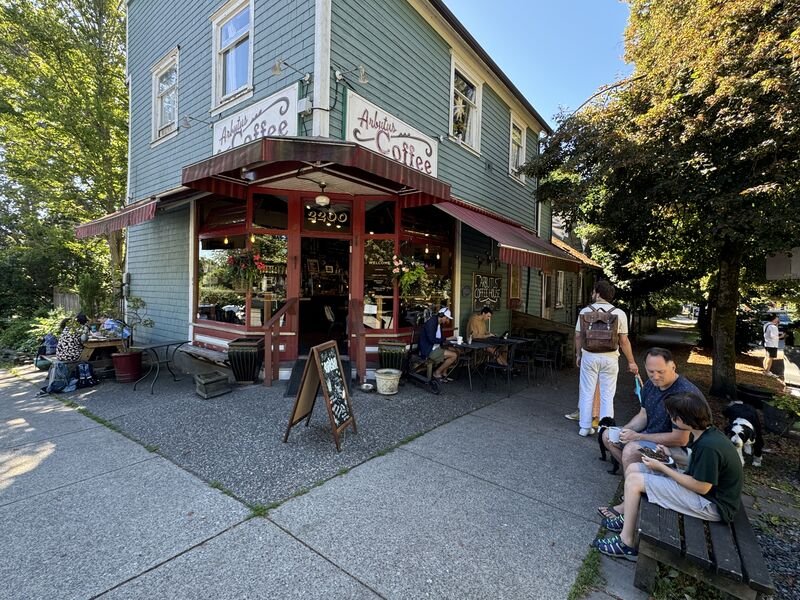
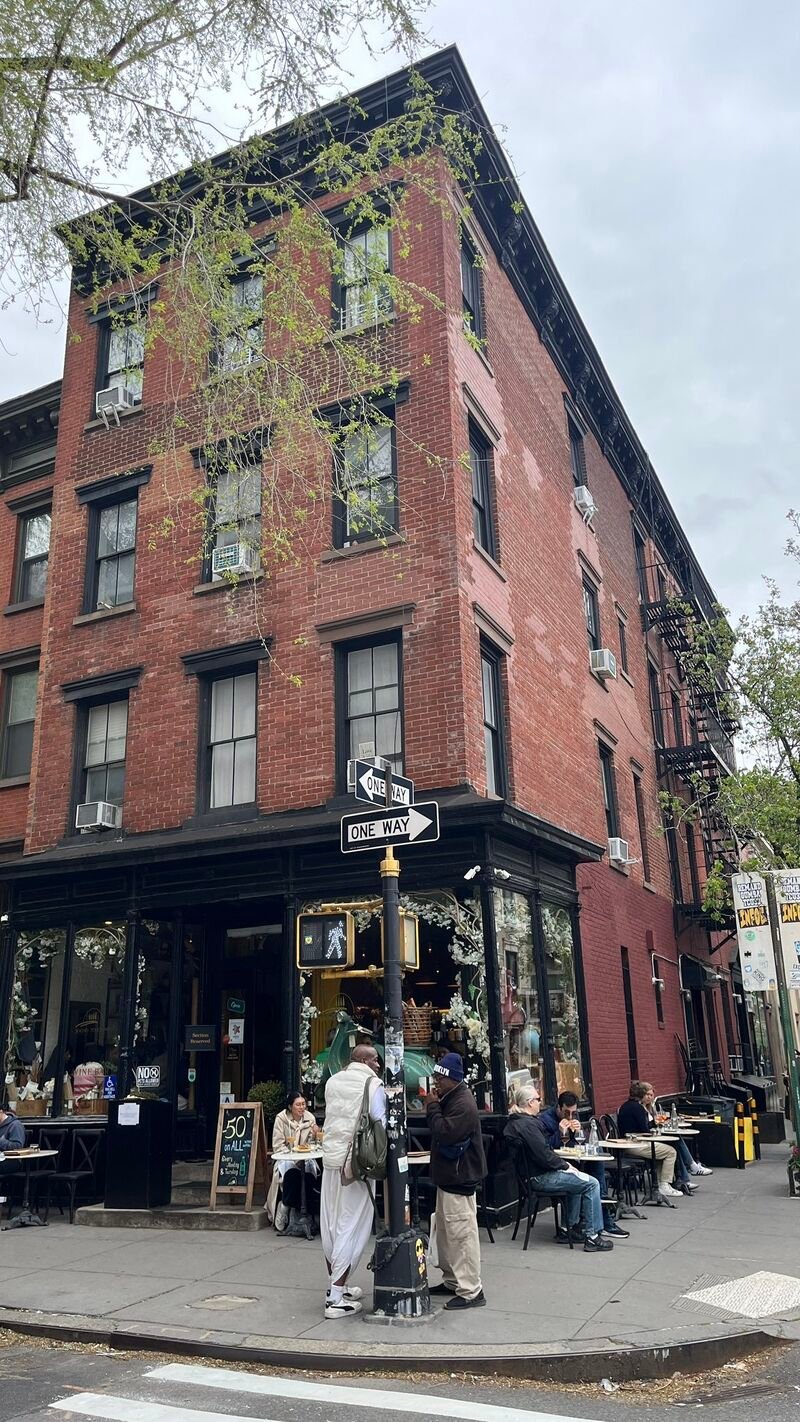
A corner coffee shop with people at sidewalk tables and on a bench A brick corner building with a shop at street level and people at sidewalk tables

Commerce and community are pedestrian activities.
Where the Trips Are

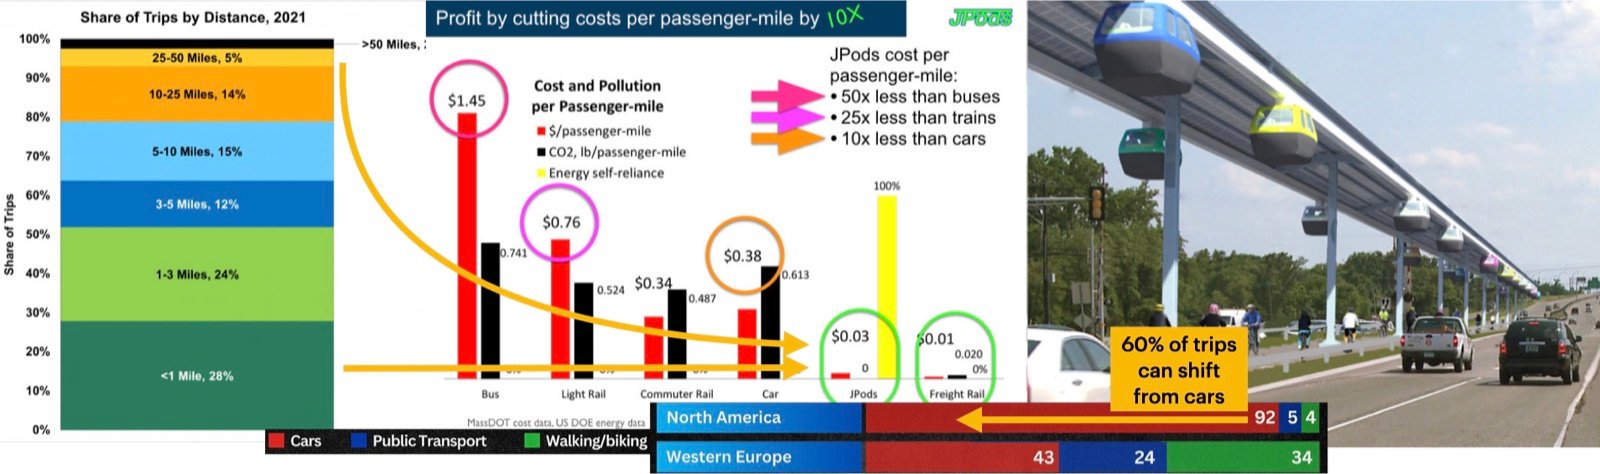
Most trips are short. 60% of trips could shift from cars.

More than half of all trips are under 3 miles, and 28% are under 1 mile. Those trips belong to walking, biking, and the middle mile. In North America 92% of trips go by car; in Western Europe it is 43%, with 34% by walking and biking. Moving a person costs $0.38 a passenger-mile by car and $0.03 by JPods.

Share of trips by distance, cost and CO2 per passenger-mile by mode, and mode share North America vs Western Europe
Share of trips by distance (2021); cost per passenger-mile (MassDOT cost data, US DOE energy data); mode share, North America vs Western Europe.

Cargo needs transport. People need walkability.

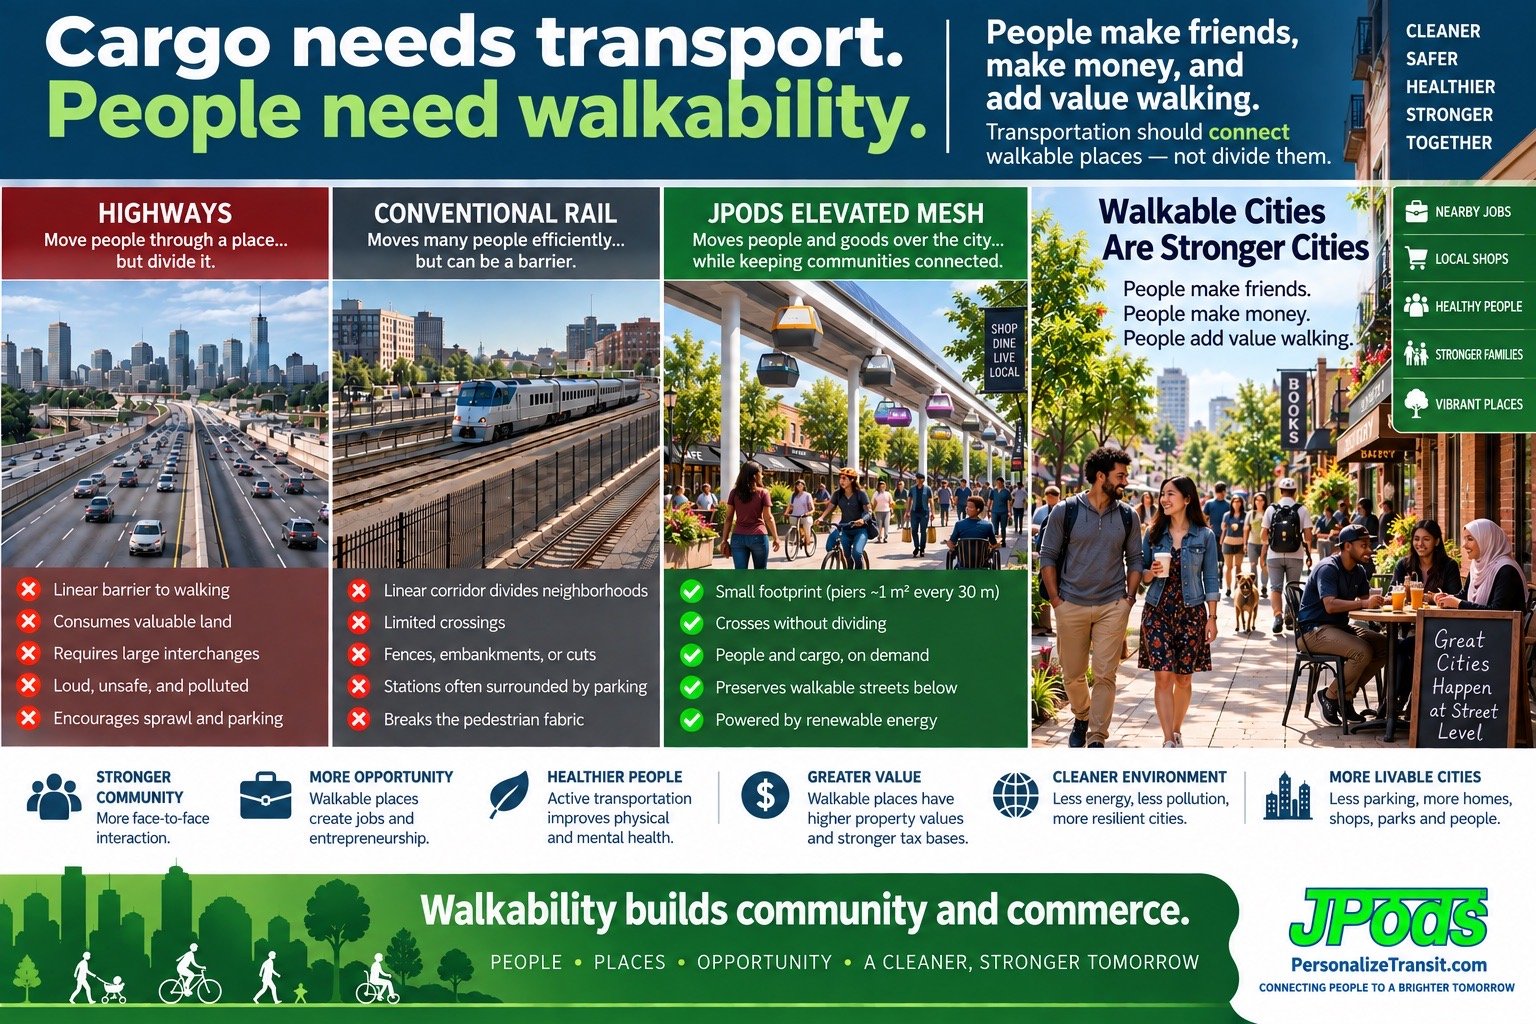
Highways and rail lines move people through a place, but they divide it. A mesh overhead crosses without dividing and leaves the street below for people. People make friends, make money, and add value walking. Only 1.2% of land in the 35 largest U.S. cities is walkable, and that 1.2% produces 20% of GDP.

Highways and conventional rail divide neighborhoods; the JPods elevated mesh moves people and goods over the city while keeping walkable streets below

The Cost of the Wrong Layer

When 2-ton vehicles do the middle mile on the street, the street stops being a place.

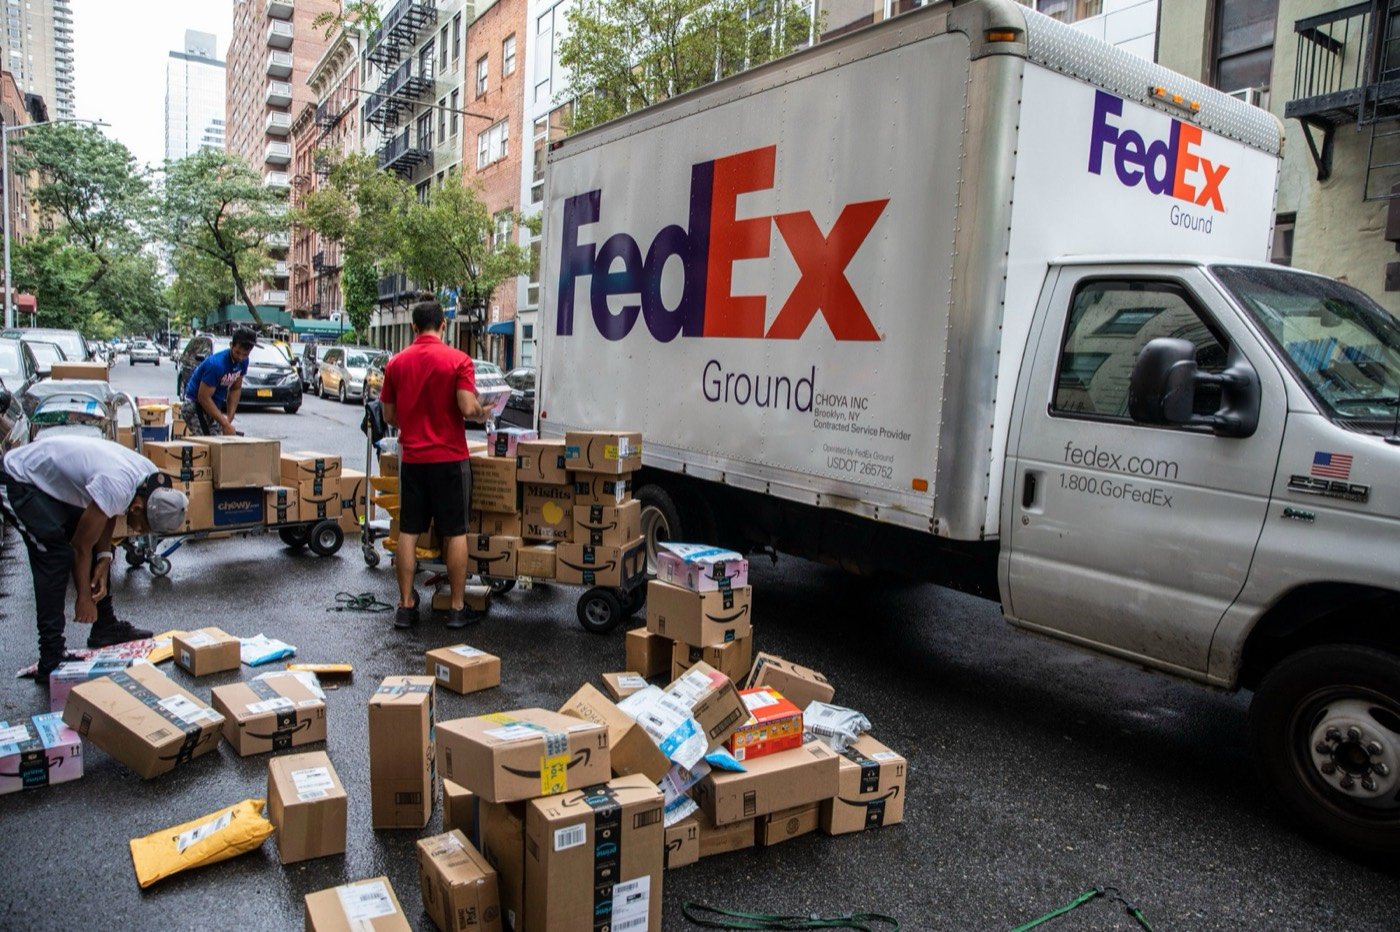
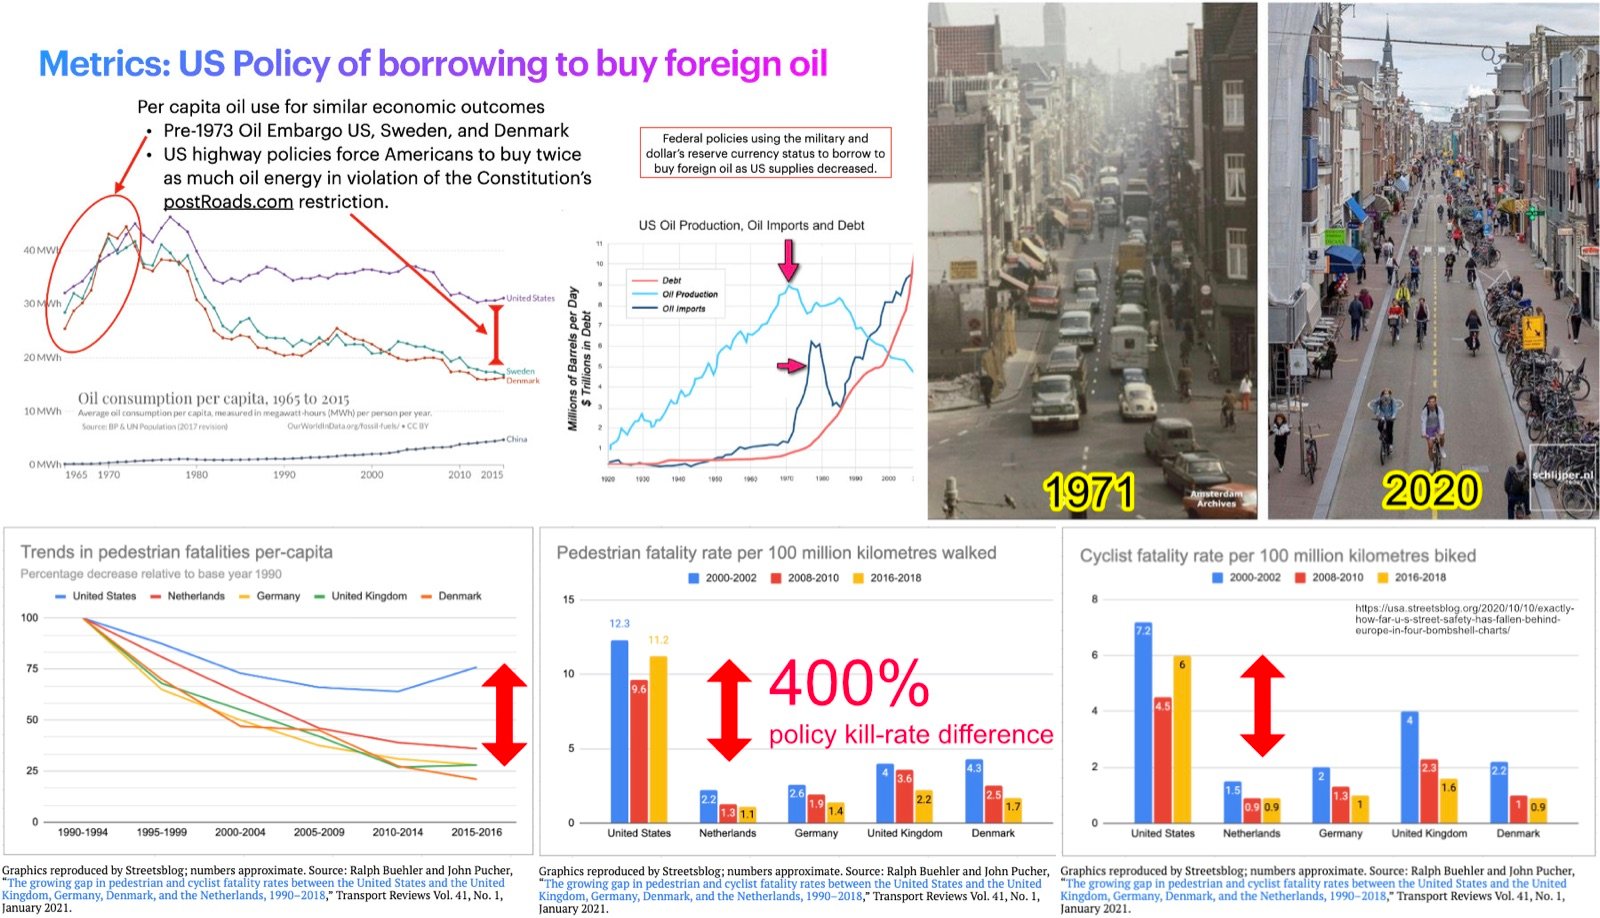
Delivery trucks double-park and unload across the sidewalk. Cars sit idling in traffic. Children can't walk to school. For each kilometer walked, an American pedestrian is about ten times as likely to be killed as a Dutch one (11.2 vs 1.1 deaths per 100 million km, 2016–2018). This follows from policy. It is not an accident of culture. Amsterdam's streets in 1971 looked like ours. The chart below shows the same Amsterdam street in 1971 and in 2020.

Parcels unloaded across a New York City street from a delivery truck
The middle mile today: a New York street used as a sorting floor.
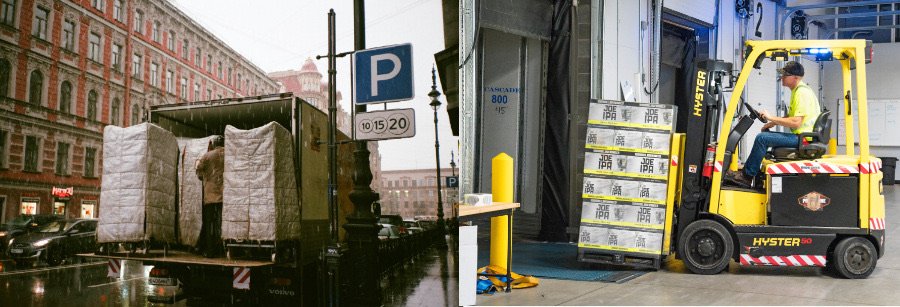
A truck unloading pallets on a city street compared with a forklift loading a pallet at a dock
Pallets unloaded in the street, versus at a dock where they belong.

Change the policy and the street changes

Before the 1973 Oil Embargo, the US, Sweden and Denmark had the same:

  • oil use, about 43 megawatt-hours per person per year;
  • safety record for pedestrians and bike riders killed on the road.

After the embargo, their road policies diverged:

  • The US kept building sprawl, as the Bragdon Committee (1957–1959) had warned against.
  • Sweden and Denmark turned from highway-centric policy to walkable, bikeable streets. Per-person oil use fell to about half the US level (roughly 17 vs 31 MWh per person per year by 2015). Per kilometer walked or biked, Americans are now killed at 5 to 10 times the rate of the Danes and Dutch.

Based on this record, JPods estimates that cities which change from car-centric to walkable policies can cut car-miles by about 60%.

Per capita oil use US vs Sweden and Denmark; US oil production, imports and debt; Amsterdam street 1971 vs 2020; pedestrian and cyclist fatality rates US vs Europe
Oil use per capita, oil imports and debt, one Amsterdam street in 1971 and 2020, and pedestrian and cyclist fatality rates. Fatality data: Buehler & Pucher, Transport Reviews 41(1), 2021, via Streetsblog.

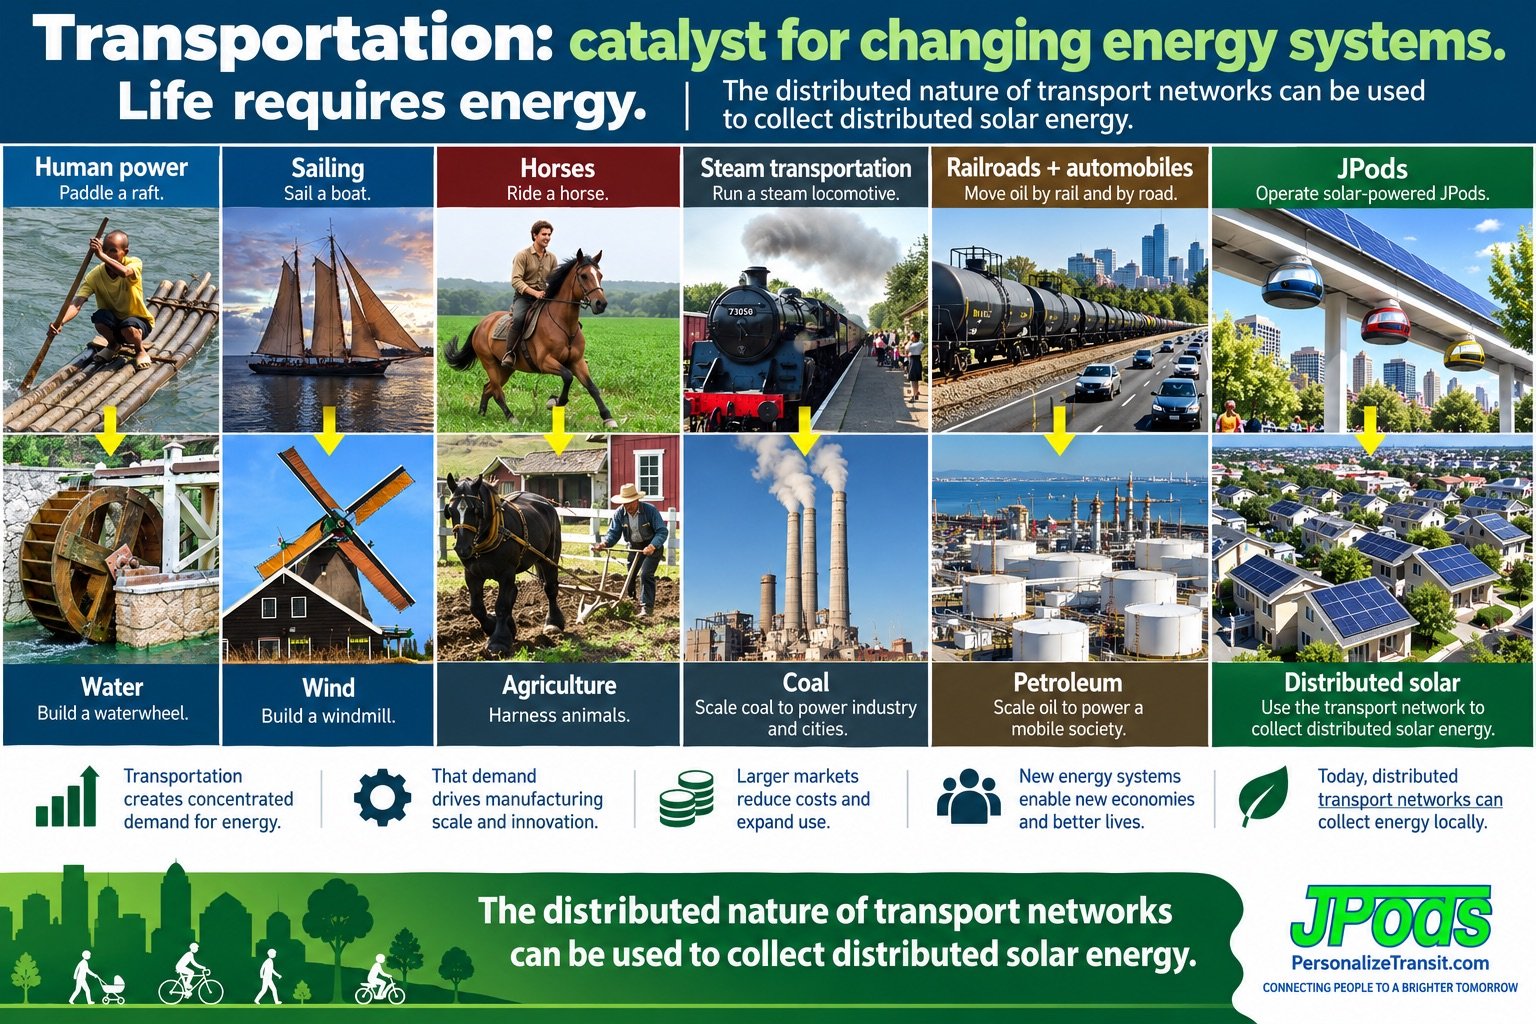
Transportation: catalyst for changing energy systems

Every transportation revolution triggered an energy revolution. The infrastructure that moves people and goods determines what energy system the economy runs on.

Six eras: human power and water wheels, sailing and windmills, horses and agriculture, steam and coal, railroads and automobiles and petroleum, JPods and distributed solar
Each way of moving created demand for a new energy system.

The Pattern

Railroads in the 1860s adapted engines to burn coal and oil, then used reduced transport costs to distribute those fuels to new markets. The railroad didn't just use coal — it created the coal economy. Highways didn't just use oil — they created the oil economy. Guideways with integrated solar collection don't just use solar — they create a distributed solar economy.

The Catalyst

In 1935, the wind industry was building 80,000 windmills a year. 50% of U.S. electricity came from renewables. The Rural Electrification Act of 1936 wiped it out in favor of centralized coal. The highway system locked in oil. Change the transportation infrastructure and you change the energy system. That is the catalyst.

Solar on JPods

JPods guideways aren't just transit infrastructure — they are distributed solar power plants. The guideway structure carries solar collectors that produce far more energy than the pods consume.

5.79
MWh / mile / day
74,000
Vehicle-miles powered
per mile of guideway
50,000
Vehicle-km powered
per km (Plantronics proof)
ModeWh / Passenger-Mile
JPods78
Commuter Rail881
Personal Car1,032
Bus1,245

I'd put my money on the sun and solar energy. What a source of power! I hope we don't have to wait until oil and coal run out before we tackle that.

— Thomas Edison, 1931

Net Energy Producer

A mile of JPods guideway with 4-meter-wide solar collectors generates 5.79 MWh per day. The pods traveling on it consume a fraction of that. The surplus powers the surrounding neighborhood. The transportation network becomes the energy network. The 5X5 Standard: 5x the energy consumed, 5x the value of the land occupied.

Plantronics Proof

Plantronics headquarters in Santa Cruz, CA: a 240-meter, 10-meter-wide solar array produces 367,410 kWh annually — 4.19 MWh per day per kilometer. At 38.5 Wh per vehicle-kilometer, that powers 50,000 vehicle-km per km of guideway daily. This is not theory. It is measured.

The Net Energy Crisis

Economies collapse when Net Energy ratios fall below 5:1. Oil has crossed that threshold. Solar hasn't. The transition is not optional — it is geological.

Wind
25:1
Solar
22:1
Oil (1970)
25:1
Oil (2020)
<5:1

Peak Fracking (June 2025)

The EIA reported U.S. peak fracking has arrived. Shale core exhaustion is mainstream. U.S. production expected down 20-30% within five years. Oil prices in the late 2020s will increase significantly. U.S. production will fall rapidly 2030-2050. Normal retooling requires ~100 years. We have 5.

Solar Cost Collapse

Global solar PV cost fell 90% between 2010 and 2023. From $0.460/kWh to $0.044/kWh. Solar is now 56% cheaper than the lowest-cost fossil fuel. In 2010, solar was 4x more expensive. The economics have flipped. The infrastructure hasn't caught up.

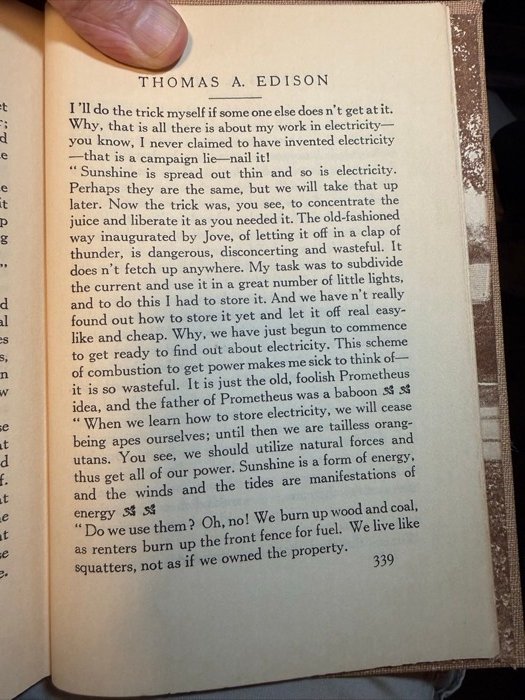
Sunshine is spread out thin and so is electricity. Perhaps they are the same… This scheme of combustion to get power makes me sick to think of — it is so wasteful. It is just the old, foolish Prometheus idea, and the father of Prometheus was a baboon.

When we learn how to store electricity, we will cease being apes ourselves; until then we are tailless orangutans. You see, we should utilize natural forces and thus get all of our power. Sunshine is a form of energy, and the winds and the tides are manifestations of energy… Do we use them? Oh, no! We burn up wood and coal, as renters burn up the front fence for fuel. We live like squatters, not as if we owned the property.

…

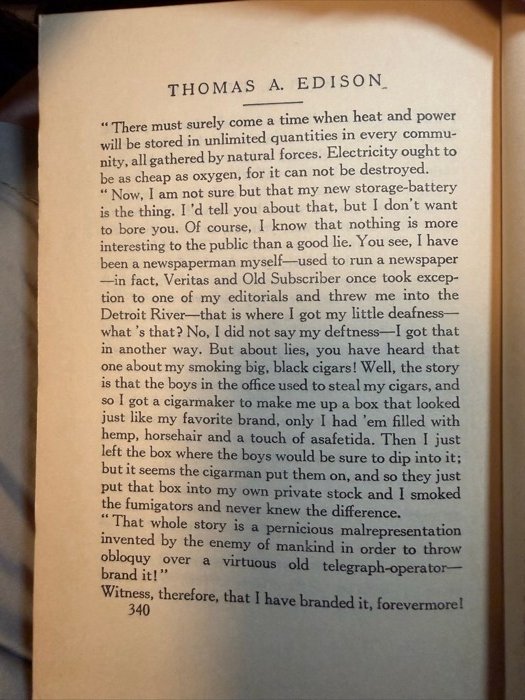
There must surely come a time when heat and power will be stored in unlimited quantities in every community, all gathered by natural forces. Electricity ought to be as cheap as oxygen….

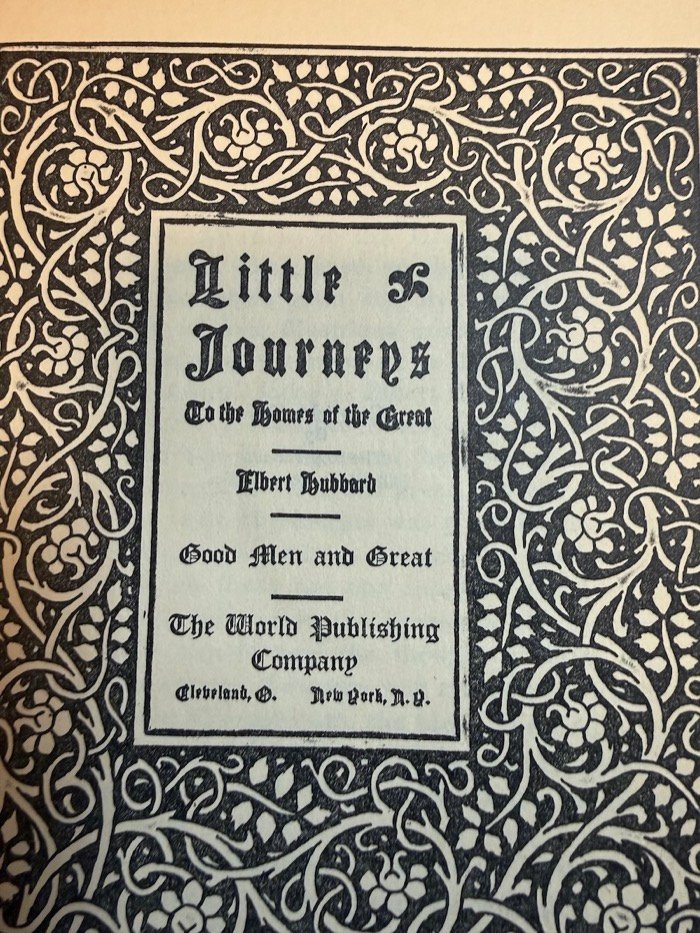
— Thomas A. Edison, as recorded by Elbert Hubbard, Little Journeys to the Homes of the Great: Good Men and Great (The World Publishing Company), pp. 339–340
Title page: Little Journeys to the Homes of the Great, Elbert Hubbard, Good Men and Great, The World Publishing Company, Cleveland and New York Page 339 of Elbert Hubbard's Little Journeys, Thomas A. Edison chapter: 'Sunshine is spread out thin and so is electricity…' Page 340 of Elbert Hubbard's Little Journeys, Thomas A. Edison chapter: 'There must surely come a time when heat and power will be stored…'
From Bill James's copy of Elbert Hubbard's Little Journeys to the Homes of the Great: Good Men and Great (The World Publishing Company), Thomas A. Edison chapter. The series was first published by Hubbard's Roycrofters.

Cargo: The Undervalued Half

Cities think about moving people. They don't think about logistics, waste, or proximity. Those blind spots are where the Physical Internet® makes its strongest case.

Inbound: Virtual Inventory

Local retailers sell products they don't stock. Supplier warehouses hold the inventory. JPods delivers pallets to neighborhood stations. Last-mile by cargo bike to the door. The retailer's capital is freed. Inventory turns approach infinity.

The math: Department stores: 40% margin × 4 turns. Discount retail: 20% × 8 turns. Amazon: thin × high turns. Virtual inventory: your margin × no limit on turns.

Outbound: Fresh Waste

Waste streamed continuously out of the city, sorted fresh on arrival. Items that go to landfill today because they are too degraded to identify or separate become recoverable when sorted fresh and continuously. Recycling rates rise dramatically when waste isn't rotted, compressed, and mixed in a weekly truck.

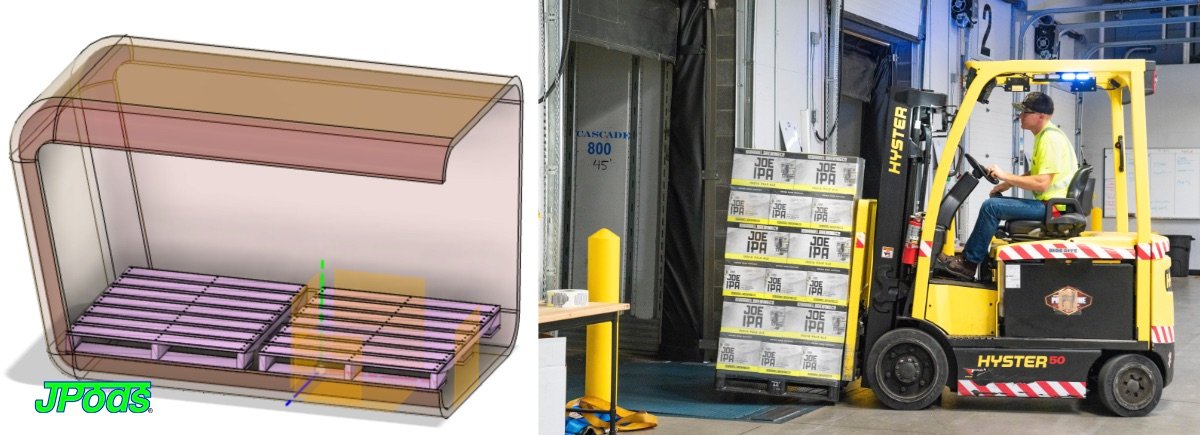
A JPods cargo pod carrying two pallets, next to a forklift loading a pallet at a dock
A cargo pod carries two pallets, loaded at the dock the way pallets already move today.

Carriers: Natural Allies

UPS, FedEx, DHL, and Amazon spend billions on middle-mile truck routes through traffic. JPods eliminates the most expensive, most congested segment. Carrier dead-heads return at ~1/10th the cost above street level with zero traffic. JPods handles middle-mile. Carriers own the van and the doorstep.

The Fiscal Case to Cities

Reduced parking demand converts low-tax parking lots to high-tax productive land (sales tax + property tax). Reduced vehicle trips extend pavement life and cut lane-mile maintenance costs. Only 1.2% of land in the 35 largest U.S. cities is walkable — yet that 1.2% generates 20% of GDP. More walkable land = more GDP per acre.

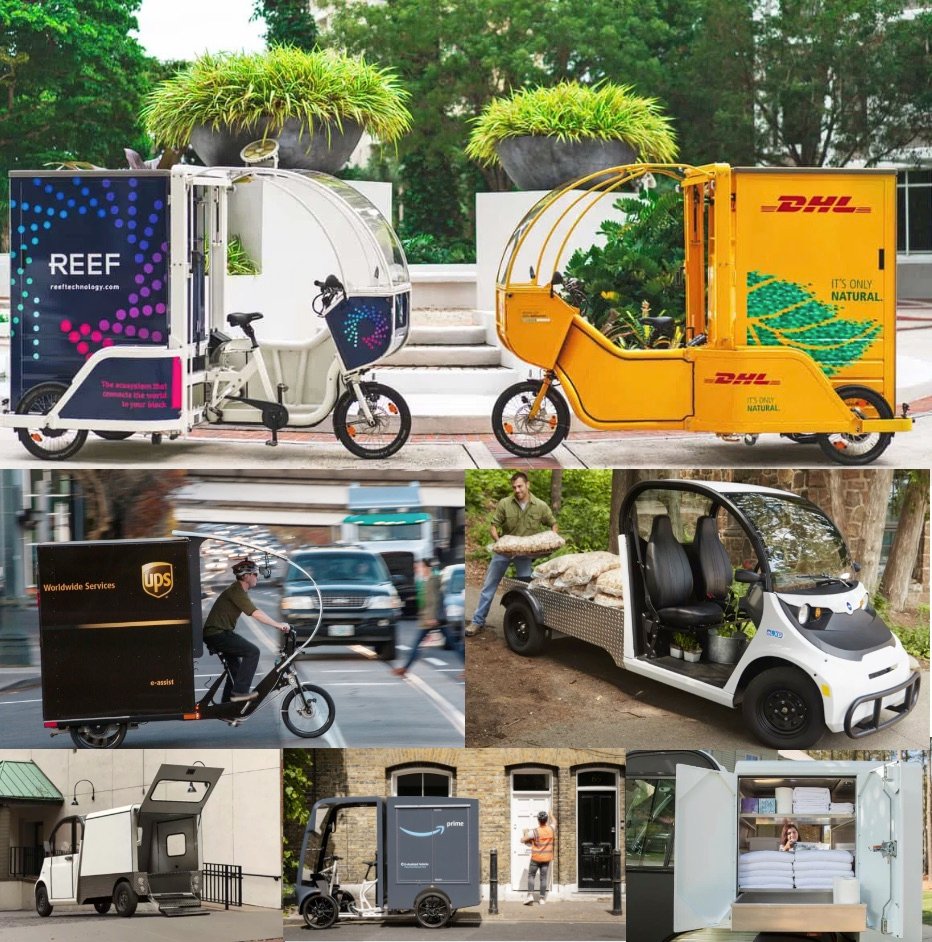
Cargo bikes and small electric vehicles used by DHL, UPS, Amazon and others for last-mile delivery
Carriers already deliver the last mile by cargo bike. JPods brings the parcels to them.
MetricTrucksJPods
FuelDieselSolar (net producer)
Middle-mile cost/ton-mileHigh~1/10th
Dead-head returnIn traffic, with driverAbove traffic, no driver
Street congestionAdds to itZero
Delivery modeBatch (weekly/daily)Continuous flow
Efficiency25 ton-mpg (highway)470 ton-mpg (rail equiv.)

The Patents

The intellectual property behind the Physical Internet® — from autonomous solar-powered guideways to distributed data centers powered by transit infrastructure.

US 6,810,817 B1

Solar-Powered Transport Networks

The foundational patent. Robots on grade-separated guideways for autonomous movement. Solar and wind power integrated into the physical structure of the guideway itself.

63/706,637 & 19/356,011

Energy Self-Reliant Guideways

Distributed renewable energy gathering, storage, and application. The guideway as power plant — collaborative energy storage across the network.

63/706,634 & 19/356,062

3-Tiered Cargo Shipments

Integrating just-in-time automated guideways with machine learning, railroad efficiency, and last-mile delivery. Subcontainers that fit pods, delivery vans, and cargo bikes.

63/921,369 & 73259682

Distributed Data Centers

Powering edge computing with guideway solar. Data centers distributed along the network, powered by the transportation infrastructure they serve.

63/706,638 & 19/356,061

Temporary Deployment

Rapid-deployment guideways for disaster response, events, and emergency mobility. Infrastructure that can be stood up and moved.

63/768,958

Border Support & Security

Automated guideway networks for border logistics, security monitoring, and controlled movement along border corridors.

Life Requires Energy

Money is a claim on future energy. An economy that burns more energy to extract energy than it gets back is an economy in decline. The Physical Internet® is the infrastructure that makes the solar economy physically possible.

188×
Cars more wasteful
than freight rail
13×
Cars more wasteful
than JPods
90%
Solar cost decline
2010–2023
$2.76T
Annual U.S.
traffic cost

Americans spend $2.76 trillion a year on traffic. Cars cost $12,182 per vehicle per year. They sit parked 95% of the time. Only 1.2% of land in the 35 largest U.S. cities is walkable — yet that 1.2% generates 20% of GDP. The Physical Internet® converts the 98.8% into productive, walkable, connected land.

Build the Physical Internet

The technology exists. The patents are filed. The economics work. The oil is running out. Start small. Iterate relentlessly.